what's the most overvalued token relative to it's open source traction? with the rise of token sales as a new funding paradigm, we've seen a really healthy dissemination of frameworks for token valuation (like this one from Chris Burniske, or a more elementary checklist from Fred Wilson). many of these frameworks think about these networks from a top-down perspective, which can be helpful in some cases, but may not be relevant in others.
i've taken a list of tokenized projects, dapps (big thanks to stateofthedapps.com) and networks and quantified their github stargazers, contributers and commits. big thanks to hugo murphy for the help here.
aside from the problem of centralizing all the world's code on a closed-source github, (quick aside: some great projects tackling that problem, from oscoin to gitcoin to gittorrent) i think github repository data remains one of the better publicly-available datasets we can use to make like-for-like comparisons across a broad array of projects.
there are other problems with this methodology. if i had more time perhaps i would weight certain stars from certain users more highly, or i would introduce a code quality screen (more volume does not mean better code), or we'd look at publicly available usage data.
many folks in the decentralized ecosystem don't trust anything that hasn't been open sourced. i certainly don't. particularly in this space, where claims are often exaggerated, and fundamental quality can be hard to ascertain, it is vital to open source your work to get community buy-in, earn community trust, and improve the quality of your code. and i don't think posting the whitepaper to github counts.
important to note that when a project has multiple repositories we used the one that was either core to development (so a core library vs. a wallet library for instance), or the one with the most stargazers. secondly, a lot of the GitHub data is accurate from Sep 17, 2017 so almost all of the numbers will be slightly higher today.
with that, let's dive in
first off, here's the dataset i'm working off of. i've open sourced it and it's fully editable, it's not entirely complete so feel free to go in there and make changes.
first off, what kinds of projects are people starting?
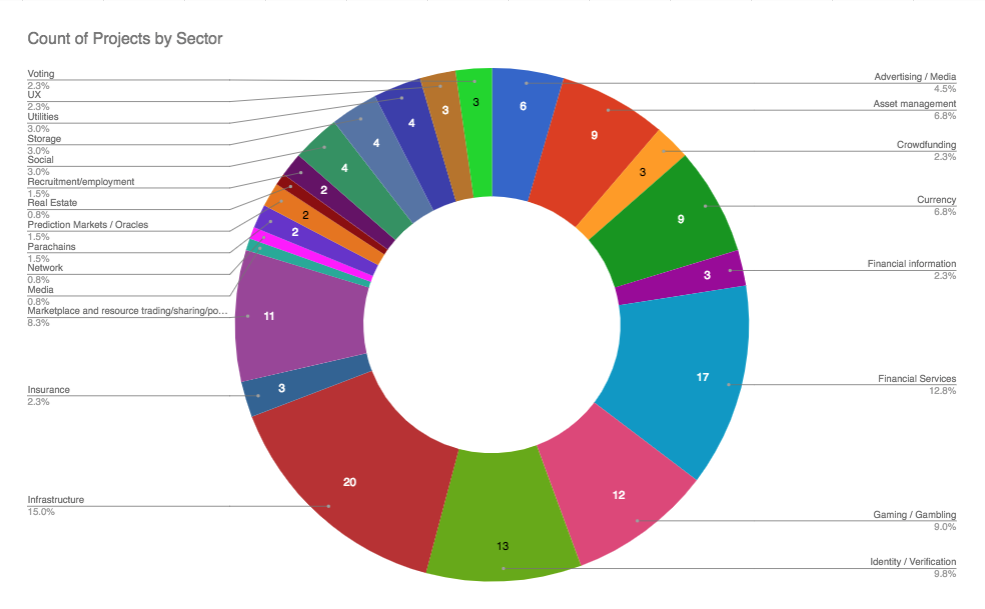
i understand that some of these categories are fairly arbitrary, and we haven't done a perfect job, but safe to say we see a pretty balanced distribution of projects across all these classes
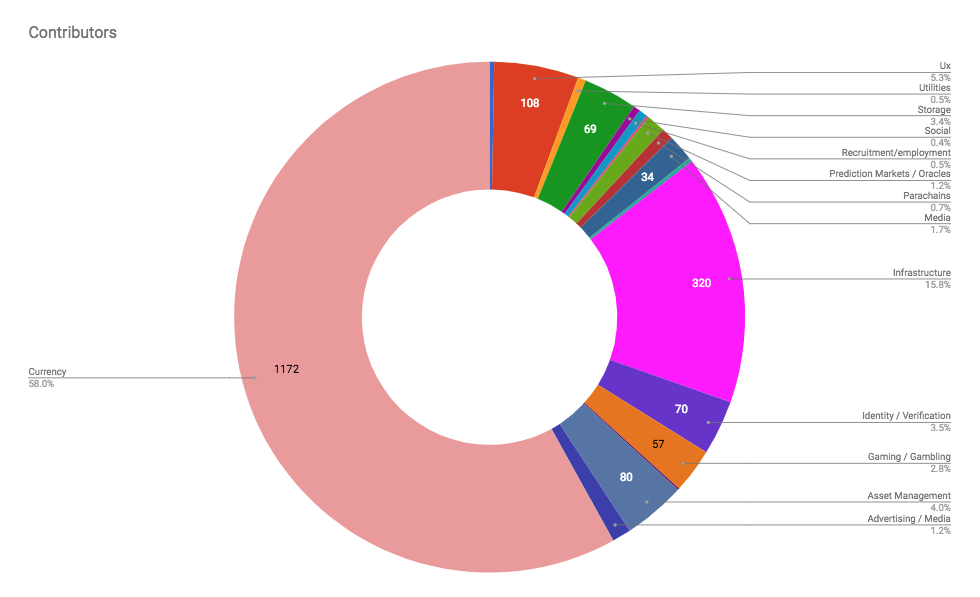
what about if we look at the breakdown of github contributors across the classes of projects? now suddenly we see currencies take the lions share, with infrastructure another major portion.
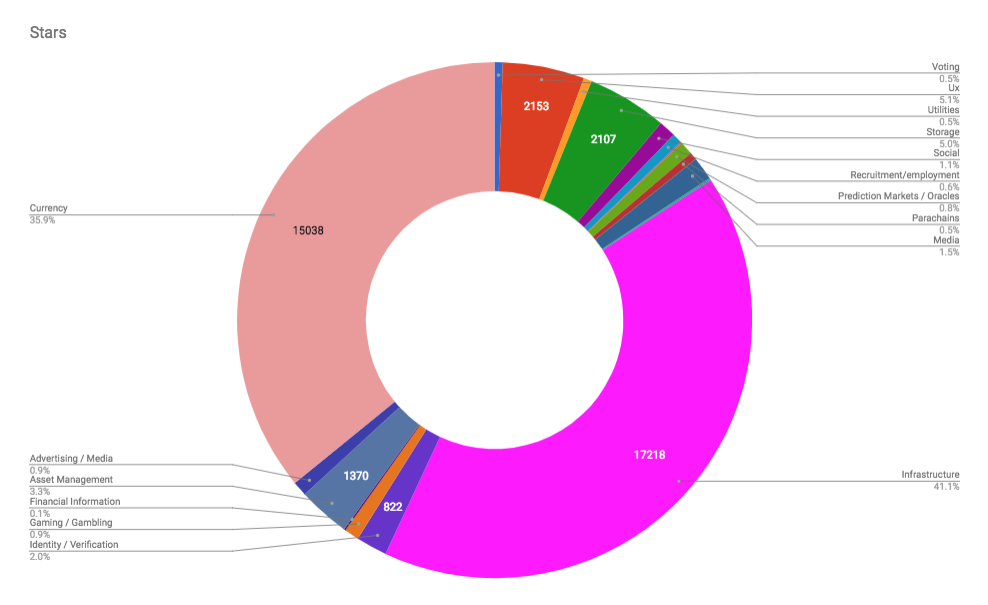
and if we look at stargazers? the interesting thing here is that infrastructure projects jump up in relevance majorly, even surpassing currencies
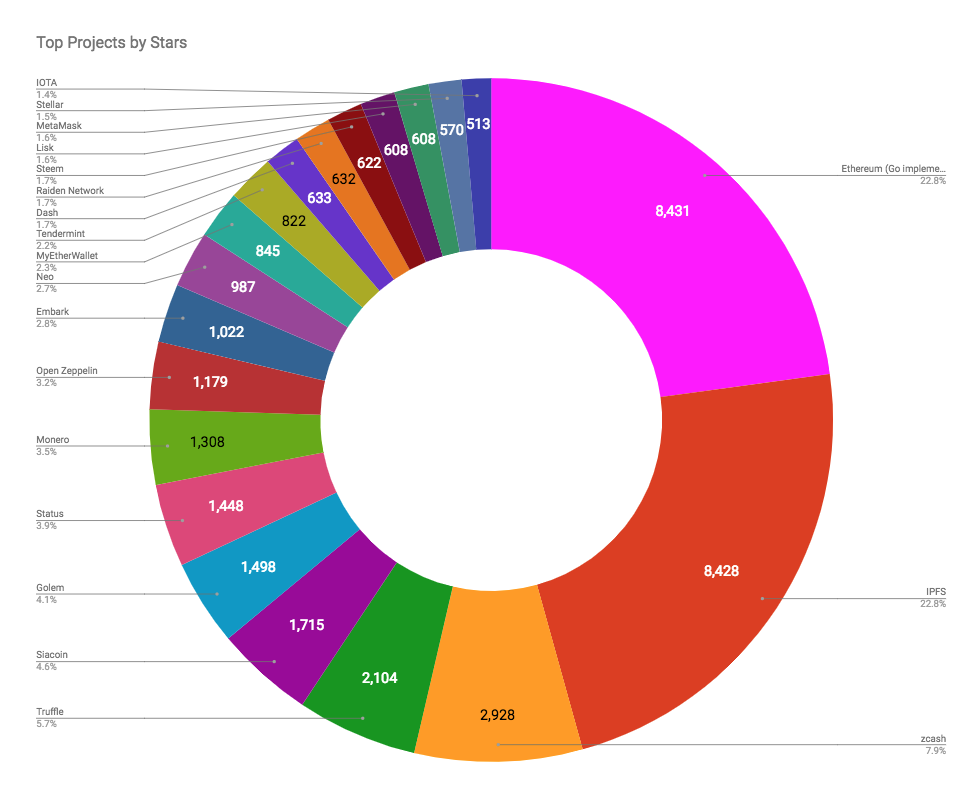
what about individual projects? let's look at the breakdown of stargazers across the top 20 projects with the most stargazers. Ethereum and IPFS are well ahead of the rest.
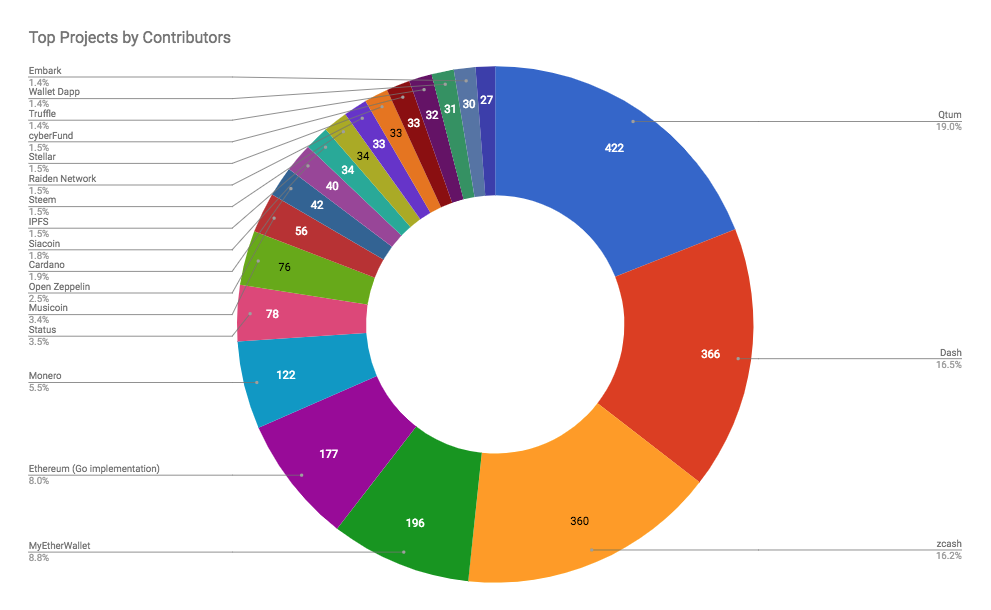
but it's a far different story for contributors. the repositories belong to the projects with most contributors are actually qtum, dash, zcash, and myetherwallet
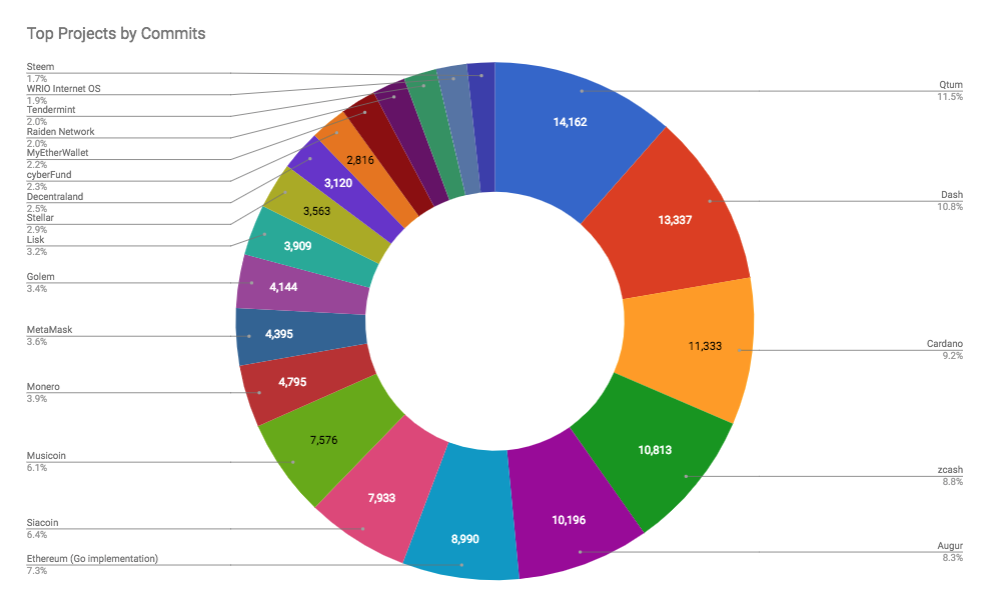
interestingly, when we look at commits across projects the breakdown starts to balance out more evenly again.
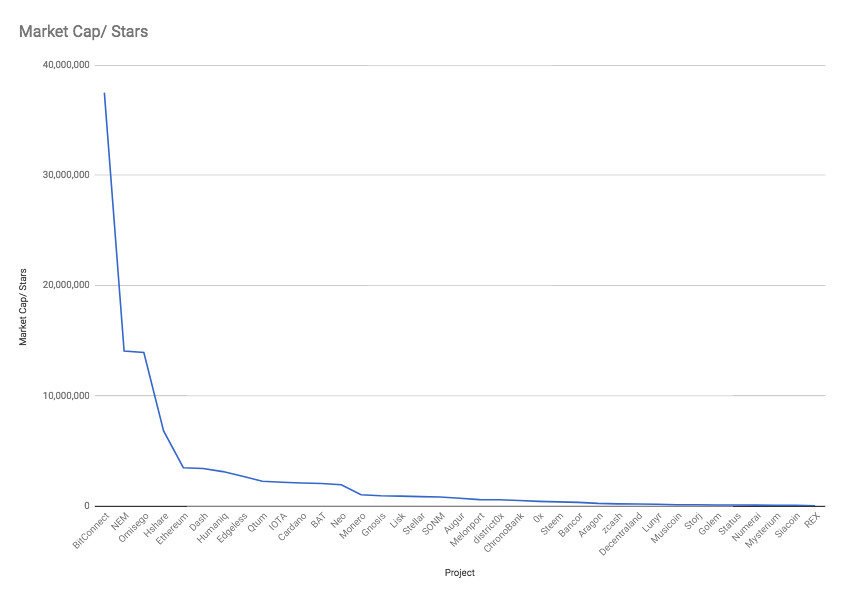
i began this post with a reference to valuation frameworks. while this is a certainly a very rough and untested framework, i would propose that looking at some measure of market cap / open-source activity multiple might belong in the toolkit of some people valuing these networks. (disclaimer: i didn't find very high correlations between market caps and any of the github metrics).
by this metric, the most "overvalued" token is bitconnect (BCC), which is valued at $1.7B and has 46 stargazers, which means it's trading at approximately $37.5M per stargazer!
as always, feedback welcome, and again please feel free to share this around along with the sheet